Choropleth maps use shading to display information, making it easy to visualize the data. This map, made in 2000, shows the percentage of Baptist residents living in the United States. Clearly, the "Bible belt" is not a made-up phrase; the majority of Baptists are located in the southeast region of the U.S. Besides the missing North marker, this map was well made with a clear title, color distinction, a scale, and a valid source.
As the name implies, a dot density map uses a dot symbol to portray information. The map has each dot representing 200 poor persons living in a nonmetro county. This form of labeling helps to visualize what areas of the U.S. have the greatest density of "nonmetro poor." Unfortunately, this 2004 map does not have a scale or a North marker.
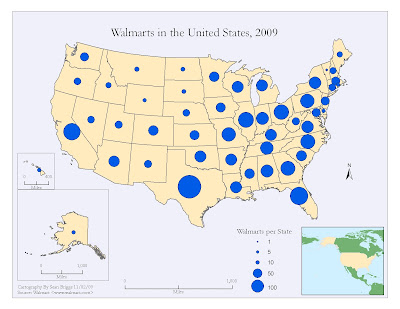
Proportional symbol maps use symbols (in this case, circles) of different sizes to represent data. The above map, made in 2009, gives us information about one of the most important stores in this country: Walmart. Each circle matches the key and tells us the number of Walmarts per state, based on the size of the circle.
An environmental sensitivity map gives a summary of coastal resources that may be at risk in the case of an oil spill. Examples of these resources that are at risk include: biological resources, sensitive shorelines, and human resources ("Environmental Sensitivity Index (ESI) Maps."). This map gives a visual aid for these at-risk resources in Hawaii. However, this map contains a large flaw: it does not tell us when it was made so we do not know how current the data is.
The final map that we will be looking at is an isopleth map. This type of map uses lines or colors to portray areas that have similar regional aspects. In the above map, the lines represent mean annual precipitation, in inches. Although it may be difficult to see, each line has a small number that indicates the mean annual precipitation within that area.
Sources Used:
"Environmental Sensitivity Index (ESI) Maps."Environmental Sensitivity Index (ESI) Maps | Response.restoration.noaa.gov. National Oceanic and Atmospheric Administration, 31 Aug. 2012. Web. 03 Sept. 2012. <http://response.restoration.noaa.gov/esi>.


